Graph / Exprgraph
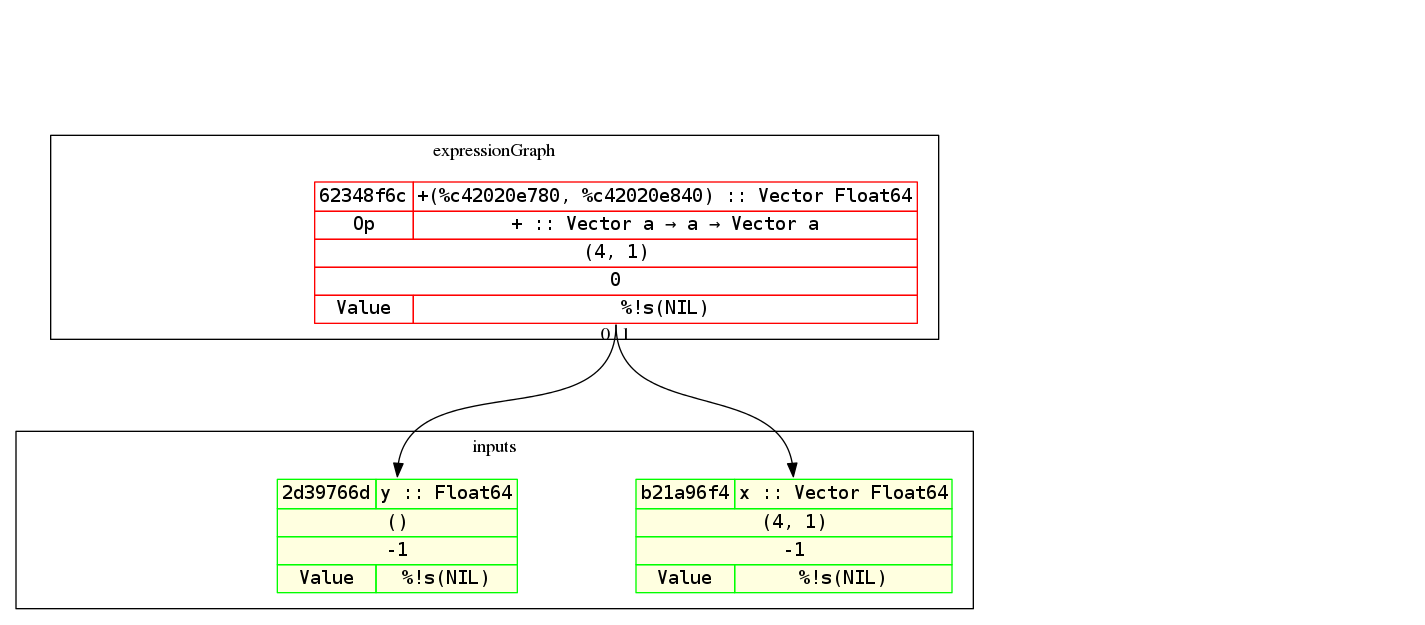
A lot has been said about a computation graph or an expression graph. But what is it exactly? Think of it as an AST for the math expression that you want. Here’s the graph for the examples (but with a vector and a scalar addition instead) above:
By the way, Gorgonia comes with nice-ish graph printing abilities. Here’s an example of a graph of the equation $y = x^2$ and its derivation:
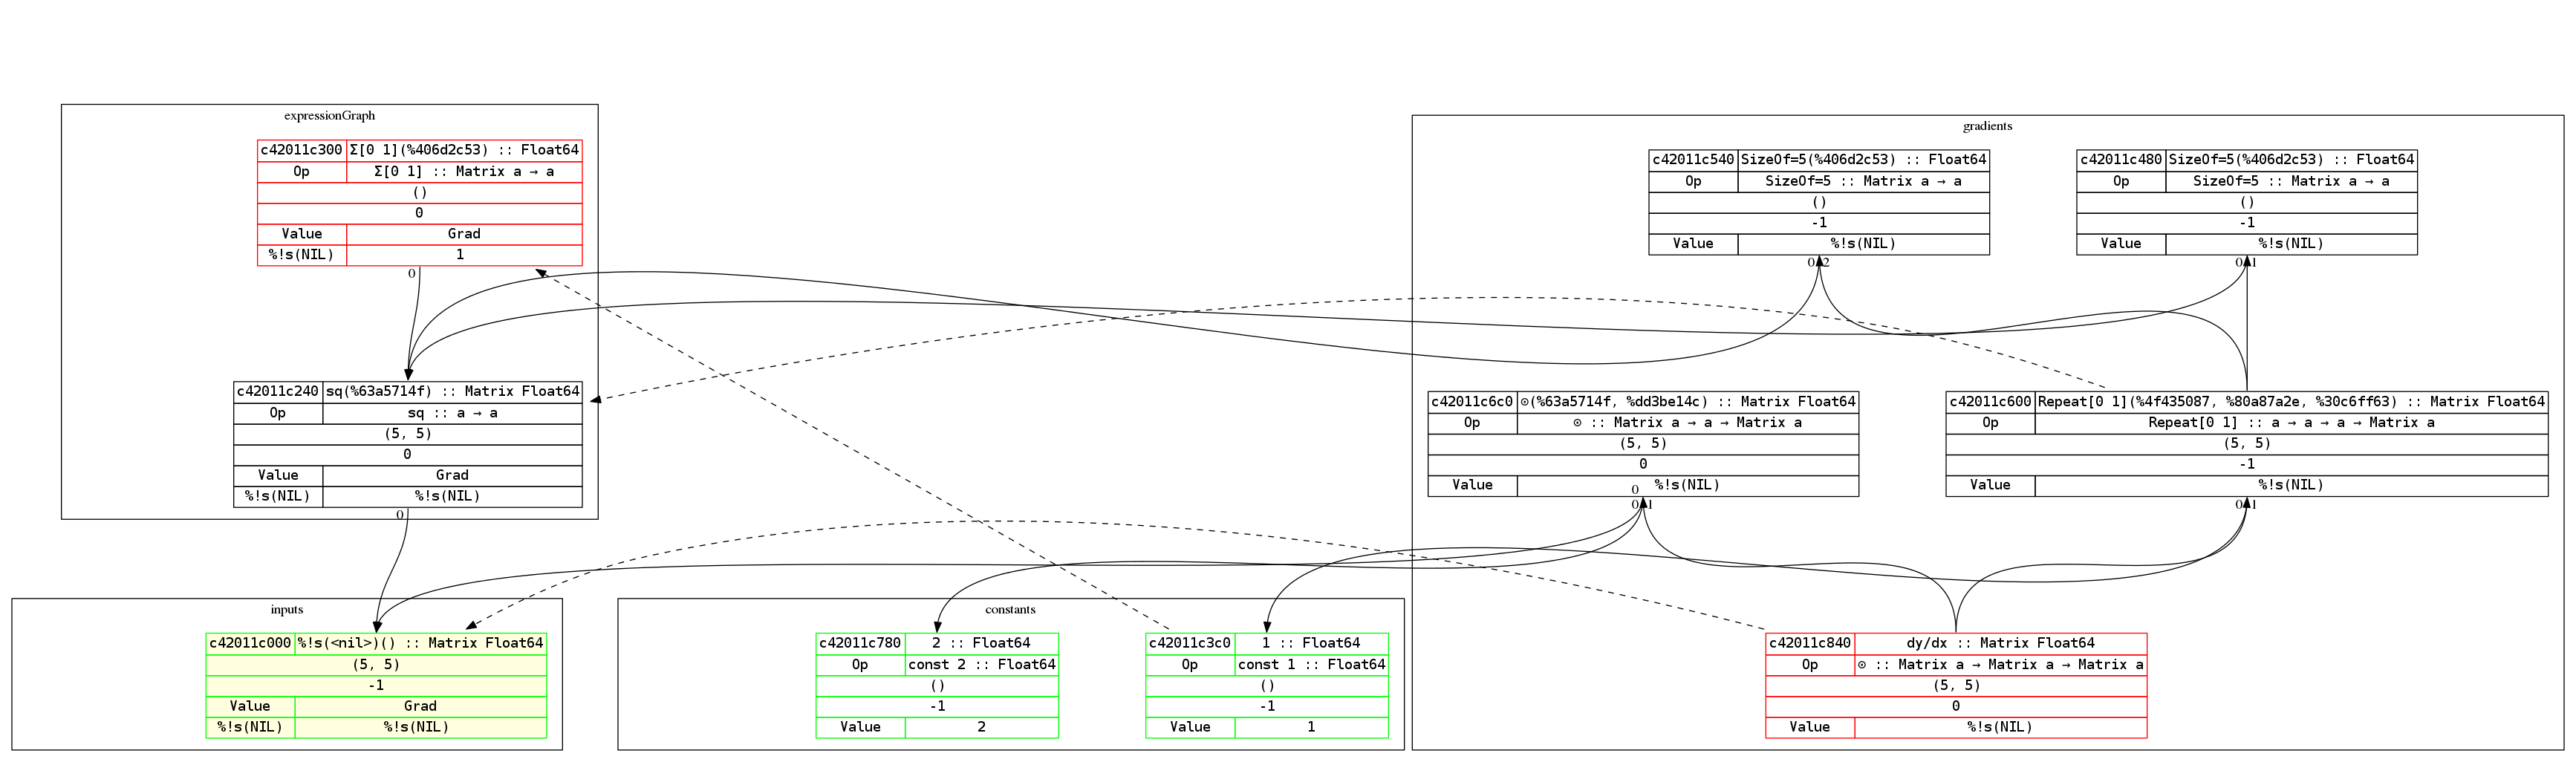
To read the graph is easy. The expression builds from bottom up, while the derivations build from top down. This way the derivative of each node is roughly on the same level.
Red-outlined nodes indicate that it’s a root node. Green outlined nodes indicate that they’re a leaf node. Nodes with a yellow background indicate that it’s an input node. The dotted arrows indicate which node is the gradient node for the pointed-to node.
Concretely, it says that c42011e840 ($\frac{\partial{y}}{\partial{x}}$) is the gradient node of the input c42011e000 (which is $x$).